
Oxford Economics Climate Briefing: How Canada’s Plan Works
Tony Stillo, Michael Davenport, & Michael Kleiman
June 26, 2021
This briefing on the Canadian government’s climate plan unveiled in April was compiled by Oxford Economics for its global clients, published June 24th, and shared with Policy for re-publication.
How the Climate Plan Makes Progress – But Still Falls Short
- Raising Canada’s federal carbon levy to C$170/tonne by 2030 will make solid progress but fall short on the country’s ambitious new pledge to cut emissions 40%-45% by decade’s end. Even so, our analysis shows higher carbon prices will hurt the economy, particularly carbon-intensive sectors and regions.
- Using our new Canada Provincial Territorial Model along with climate levers in our Global Economic Model, we find that higher carbon prices will cut national energy emissions 25%, or 136 mega-tonnes, below our baseline by 2030. National GDP falls 1.9% below baseline by 2030 (0.2ppts lower annual growth) even with carbon revenues fully recycled back to households and businesses.
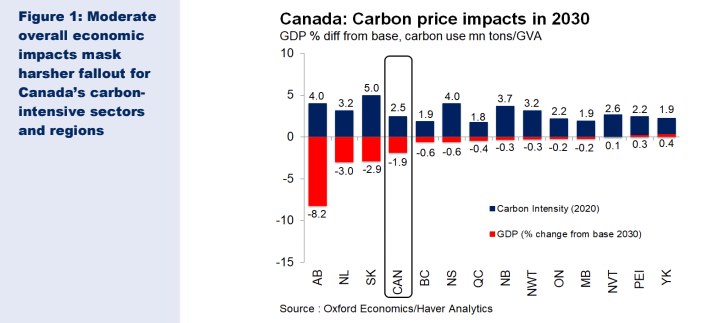
- Carbon-intensive regions will likely suffer worse. By 2030, GDP could drop 8% below baseline in Alberta and by around 3% in both Saskatchewan and Newfoundland mainly due to sharply curtailed oil output as global demand falls.
- Our modelling focuses on the emissions implications from reduced fossil fuel use, but it strongly suggests that a much higher carbon price and enriched complementary measures are needed now to achieve Canada’s ambitious 2030 emission reduction target.
- A more substantial carbon price sooner is also a stronger market signal for behavioural changes and adoption of green alternatives. This would cut economic costs and lift environmental gains by more than our analysis finds.
- Discover more about our new Canada Provincial Territorial Model here.
Canada’s climate plan
Carbon pricing is arguably the most cost-effective way to reduce greenhouse gas (GHG) emissions. A permanent and significant relative price shift that makes polluters pay provides a market-based signal to alter behaviour and have agents decide how best to respond.
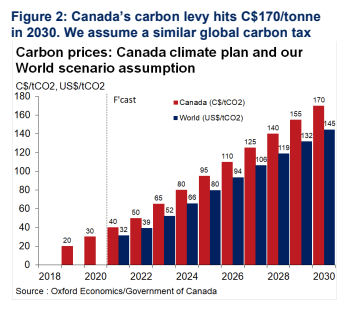
The signature initiative in last December’s federal Climate Plan update calls for a C$15/tonne annual increase in Canada’s backstop carbon levy, from C$50/tonne in 2022 to C$170/tonne in 2030 (Figure 2). The federal government also proposes a broad suite of complementary measures (e.g., energy efficiency standards, building retrofits, zero-emission vehicle policies, and clean fuel standards) to help achieve its climate abatement objectives.
At the Earth Day Virtual Summit in April, Canada upped its 2030 emission reduction target from 30% to 40%-45% below 2005 levels. Our analysis suggests even higher carbon prices and richer complementary abatement policies than currently proposed will be required to cut emissions 236mt-273mt and meet Canada’s new target (Figures 3 and 4).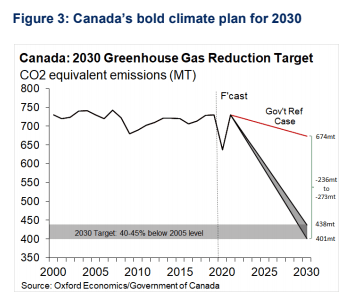
Key scenario assumptions for our modelling
We used our new Canada Provincial Territorial Model (CPTM) alongside the climate levers in our Global Economic Model (GEM) for this analysis. The CPTM permits a rigorous and comprehensive bottom-up assessment of the impact of carbon pricing for over 100 industries in each province and territory (see Appendix I).
Carbon pricing and abatement regimes vary across Canada. While the federal carbon pricing “backstop” technically applies only in jurisdictions that either have no carbon price or have adopted the federal system, for illustrative purposes we examine a common national carbon price in all provinces and territories. Our modelling then fully recycles carbon revenues back into their province or territory of origin — 90% to households and 10% to corporations — in line with Canada’s current practice.
Our analysis also assumes a 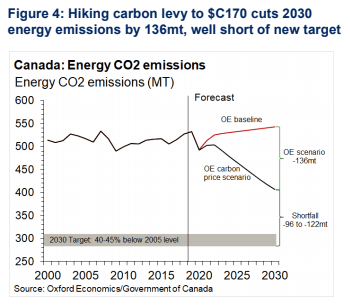 parallel carbon tax to Canada’s levy is implemented worldwide. It’s likely that the US and other nations will soon introduce climate abatement measures that either directly or indirectly raise the cost of carbon. Globally, our modelling assumes 100% of carbon proceeds are fully recycled back to households in their country of origin (See Appendix II for key assumptions).
Moderate Canada-wide economic impact
We find that rising carbon prices will likely have a moderately negative impact on the overall Canadian economy. We expect GDP will fall 1.9% below baseline by 2030, which implies average annual growth would be 0.2ppts lower this decade (Figure 5). The economic impact would be even worse without recycling carbon revenues, energy efficiency improvements, or increased renewables.
The most visible sign of increasing carbon prices will be higher consumer prices, particularly for fossil fuels. 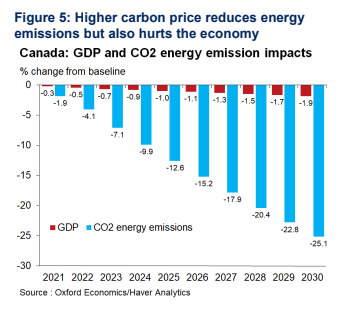 Assuming full pass-through to consumers, we expect energy prices will rise an average 3ppts faster each year than in our baseline outlook for the 2022-2030 period. This directly and indirectly pushes up headline CPI inflation an average 0.2ppts per year above our baseline forecast this decade.
Carbon-intensive sectors and regions hit hard
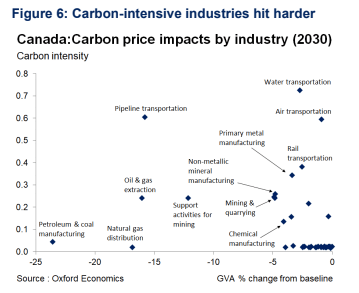
Nationally, petroleum and coal manufacturing is the hardest hit sector (-23.6% by 2030) followed by natural gas distribution (-16.9%). Oil and gas extraction (-16.1%) and its support activities (-12.2%) would suffer substantial impacts by 2030. Pipeline transportation (-15.8%) would also experience a large hit, given its close ties to the broader oil and gas extraction sector. Carbon-heavy manufacturing sectors follow closely behind, with producers of nonmetallic minerals (-4.8%), chemicals (-4.1%), paper (-3.4%), and primary metals (-3.4%) likely to see a negative fallout from higher carbon prices (Figure 6).
 We expect carbon-intensive provinces like Alberta (-8.2%), Newfoundland & Labrador (-3%), and Saskatchewan (-2.9%) will suffer sharp output losses by the end of the decade. This is largely due to their heavier reliance on the hard-hit oil and gas extraction sector as global demand falls and shifts to lower-carbon sources of energy (Figure 1).
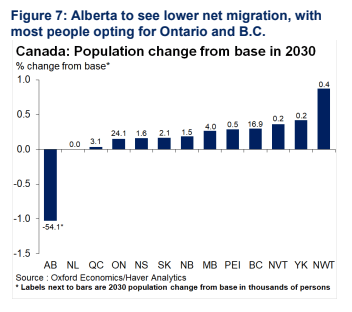
Lower net migration for Alberta, as Canadians settle in relatively better-off regions
The Alberta economy also fares worse due to lower net interprovincial migration. More Albertans are likely to leave the province, and fewer Canadians are likely to migrate to Alberta. By 2030, we project its population will fall 54,100, or 1% below the baseline. In absolute terms, net migration will be up most in Ontario (+24,200, +0.2%) and British Columbia (+16,900, +0.3%), with the biggest relative gain in the Northwest Territories (+400, +0.9%) (Figure 7).
 Alberta makes up one-quarter of emission cuts
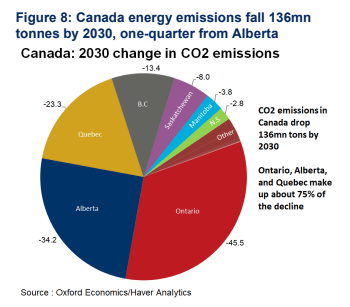
Higher carbon prices will cause Canada-wide energy CO2 emissions to fall 136 million tonnes, or 25%, by 2030 relative to our baseline.
Alberta (-34.2mn, -25.5%) would account for about one-quarter of the 2030 national decline in energy emissions given its heavy reliance on the oil industry. Together, Alberta, Ontario and Quebec would make up about three quarters, or 103mn tonnes, of the 2030 reduction in national emissions (Figure 8).
Oil extraction hit hardest in Alberta, Newfoundland, Saskatchewan, and Manitoba
Our new CPTM allows us to assess carbon price impacts at a granular sectoral level and for all 13 provinces and territories.
By 2030, oil and gas extraction output will likely experience a pronounced contraction in Alberta (-18.9%),
Newfoundland and Labrador (-8.9%), Manitoba (-12%), and Saskatchewan (-7.6%) (Figure 9).
Oil and gas extraction directly and indirectly accounts for a large share of economic activity in these provinces (aside from Manitoba), a key reason they
would also experience large GDP declines.
Primary metal manufacturing will also suffer
Manufacturing will also see substantial output losses across most regions, particularly for carbon-intensive subsectors. Alberta (-11.9% by 2030), Saskatchewan (-11.2%), and New Brunswick (-3%) will likely suffer the sharpest drop in manufacturing, while larger provinces such as Ontario
(-1.2%) and Quebec (-1.3%) will experience less substantial negative impacts.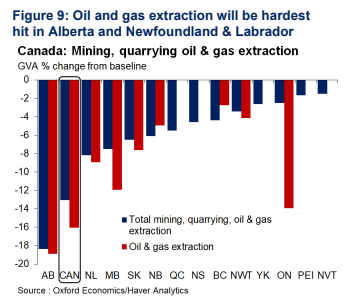
Carbon-intensive primary metals manufacturing in Saskatchewan (-18.4%) and Alberta (-16.5%) will incur the largest output losses by 2030, while smaller but still substantial declines are likely in New Brunswick (7.1%), Manitoba (-6.3%), and Ontario (-4.3%) (Figure 10).
Appendix 1: Canada Provincial Territorial Model
Our new Canada Provincial Territorial Model (CPTM) provides a rigorous and comprehensive bottom-up framework for forecasting, developing scenarios, and conducting impact analyses of detailed industry sectors at the national, provincial, and territorial levels.
The model is regionally bottom-up and directly linked to our Global Economic Model (GEM). This allows the CPTM to address questions on a wide range of economic and related topics such as the regional and sectoral impacts of global crude oil price changes or the effects of industry-specific events like a house price correction or government policy measures on carbon pricing and much more.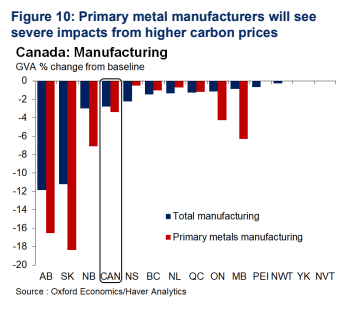
- All provinces and territories are covered. The CPTM includes:
- Provinces: Alberta, British Columbia, Manitoba, New Brunswick, Newfoundland and Labrador, Nova Scotia, Ontario, Prince Edward Island, Quebec, Saskatchewan
- Territories: Northwest Territories, Nunavut, Yukon
- Canada and world bloc
Comprehensive coverage
Our new model includes a detailed breakdown of key indicators for over 100 industries for each province and territory. This includes gross value added, gross output, employment, investment, and more. In addition, the model contains a detailed energy and greenhouse gas emissions bloc, allowing for a deeper understanding of energy- and environmental-related themes such as climate change. We also include detailed coverage for each province and territory for GDP, domestic demand, interprovincial and international trade, prices, labour markets, demographics, migration, fiscal accounts, housing, and more. Please visit our website for additional information about our new Canada Provincial Territorial Model.
Appendix II: Carbon pricing scenario assumptions
We used our new Canada Provincial Territorial Model (CPTM) in tandem with the climate levers in our Global Economic Model (GEM) to quantify the economic and environmental implications of rising carbon prices. Canada’s Output Based Pricing System (OBPS) aims to mitigate carbon leakage and competitiveness concerns for large emitters. These issues are relevant only if Canada “goes it alone” regarding carbon pricing. However, our analysis assumes a parallel carbon tax to Canada’s levy is implemented worldwide. We believe it’s likely that the US and other nations will soon introduce some form of carbon pricing (carbon tax, cap and trade, carbon border adjustment, or regulation) that either directly or indirectly raises the cost of carbon.
-
- At the recent Earth Day summit, many countries vowed to sharply curb GHG emissions:
✓ US: 50% below 2005 levels by 2030, more than double its prior pledge
✓ European Commission: 55% reduction from 1990 levels by 2030
✓ Britain: 78% cut from 1990 levels by 2035
✓ Japan: 46% reduction from 2013 levels by 2030 - Our research suggests that if decisive global action is delayed further, a disorderly scenario will likely unfold and require much stronger policy action to reach net-zero emissions by 2050.
- Accordingly, this report does not consider implications due to possible mixed price signals for businesses from the OBPS or due to compliance complexities from the varied carbon schemes across Canada.
- At the recent Earth Day summit, many countries vowed to sharply curb GHG emissions:
Our analysis also assumes the following:
Electric vehicles will account for 15% of total kilometres driven in 2030 across Canada, half of the EV30@30 Campaign target to collectively reach a 30% market share for electric vehicles in 2030.
Renewables’ share of electric power generation in Canada is 9% higher by 2030 than in the baseline.
Electric power generated using natural gas sees a 1% per year efficiency improvement by 2030, double the annual rate during the 2009-2019 period.
Canada’s energy intensity continues to fall. By 2030 coal intensity drops -62%, natural gas intensity -18%, electricity intensity -0.2%, and oil intensity -5%, with light-duty vehicle fuel intensity -36%, reflecting the Canadian government’s plan to resume 5% annual improvements in fuel efficiency starting in 2023.
The estimated economic and environmental impacts in our modelling should be interpreted as a “lower bound.”
- The CPTM captures the effect of higher carbon prices on energy use/emissions that result primarily from lower domestic and global demand for fossil fuels, but it does not fully account for the potential shift in consumption to low-carbon sources. Consequently, our analysis likely underestimates the potential for carbon prices to incentivise households and businesses to rapidly transition to low-carbon alternatives.
- Our analysis does not directly incorporate investment related to green technological shifts. Consequently, the results likely understate the potential short-term upside from demand that might be stimulated by investments in energy efficiency and renewables. But over time this would be offset to a certain degree by the increased financing costs related to these investments.
- Our modelling also does not assess potential changes to the structure of production (i.e., entry of new clean-technology industries), nonenergy sources of emissions, complementary abatement policies, or carbon capture and storage opportunities.
Oxford Economics is a leader in global forecasting and quantitative analysis, with the world’s only fully integrated economic model and 250 full-time economists to help clients track, analyze, and model country, industry, and urban trends.