
A Fine Balance: Trade Deficits and the New NAFTA
Michael Gregory
As with so many elements of policy, Donald Trump has made it clear that he takes trade deficits personally. In its submission of its negotiating objectives for the trilateral renegotiation of NAFTA that began in August, his administration listed the aim of improving America’s balance of trade with Canada and Mexico. Here’s a breakdown of the numbers.
The first round of NAFTA negotiations between the United States, Canada and Mexico was held in Washington, D.C. on August 16-20. Interestingly, August 16 was the earliest talks could commence after the Trump administration formally notified Congress (on May 18) of its intention to reopen the 23-year-old trade agreement. The U.S. legislation mandating the minimum 90-day consultation period also compelled the administration to publicize its objectives one month before the opening of talks, which it did on July 17. The 17-page Summary of Objectives for the NAFTA Renegotiation contained 117 “specific negotiation objectives” along with scores of sub-objectives.
The first specific objective sums up the administration’s intentions succinctly, to “improve the U.S. trade balance and reduce the trade deficits with the NAFTA countries”, with respect to trade in goods. The U.S. goods and services trade deficit has stabilized in recent years, running in the $450-to-$550 billion range, which is well below the record shortfalls registered before the Great Recession (Chart 1). It benefitted from two trends; a growing trade surplus in services (recently hitting record highs) and a shrinking trade deficit in petroleum (recently running at 18-year lows owing to the fracking boom). However, this also means the U.S. trade deficit in non-petroleum goods has steadily deteriorated, now running at record highs above $700 billion. Unfortunately, reducing the trade shortfalls with the NAFTA countries won’t make much of a dent in America’s total trade deficit.
In 2016, the U.S. goods trade deficit (both petroleum and non-petroleum) totalled $737 billion, with China accounting for nearly half the shortfall (Table 1). This is five times more than the next largest contributor, Japan (at 9.3 per cent). Germany accounted for slightly more of the deficit than Mexico, but the shares are comparable (in the 8 per cent-range). Canada came in 15th at 1.5 per cent, with a surplus in trade in goods of $11 billion, but when a U.S. surplus in services is included, the Americans enjoy a $12 billion surplus with Canada. As an economic bloc, the euro area’s share of the U.S. trade in goods deficit was 17.1 per cent, much larger than NAFTA’s 10.2 per cent. So, even if NAFTA trade shortfalls were sliced in half, the U.S. would still be running $700 billion-plus deficits.
 The U.S. currently runs surpluses in services trade with both Canada and Mexico, mirroring its global performance. The services surplus was $24 billion with Canada in 2016, pushing as noted above the total goods and services trade balance into surplus territory for the U.S. The services surplus was $7 billion with Mexico, leaving the total trade balance deep in deficit territory. The negotiation objectives also cover trade in services, citing specifically telecommunications and financial services.
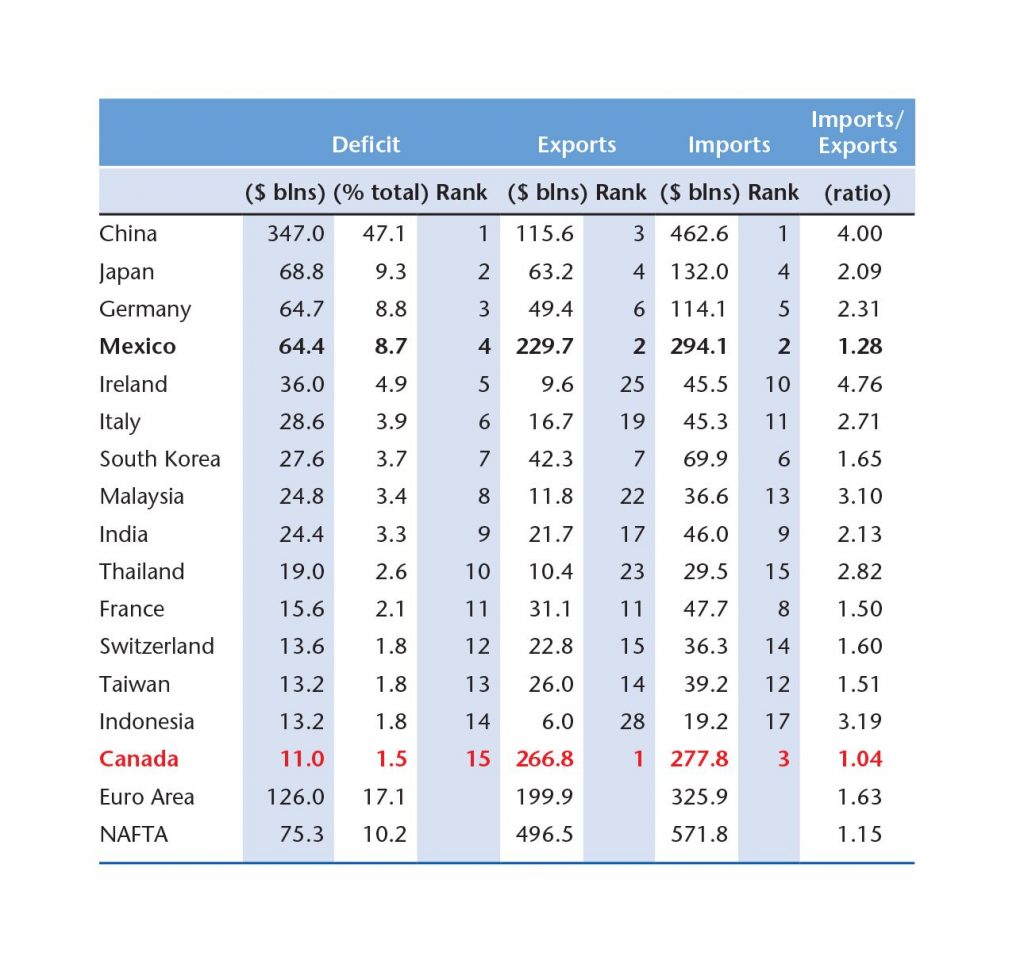
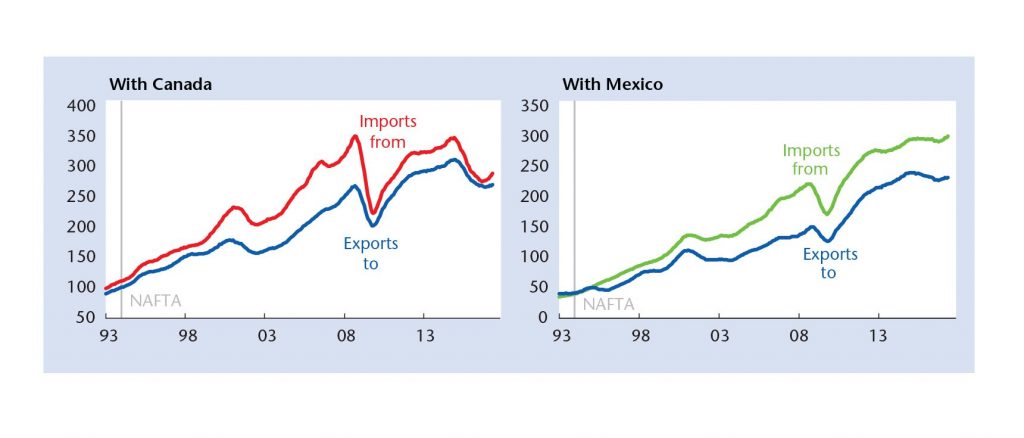
In addition to representing a relatively small share of the total trade deficit, U.S. trade with Canada and Mexico is much more equitable compared to the other deficit-contributing countries. Canada is America’s largest export market, followed by Mexico; Mexico is the U.S.’s second-largest import origin (China is the largest), followed by Canada. In the case of Mexico, the seemingly large $64 billion trade deficit reflects $230 billion in exports and $294 billion in imports, with the latter 28 per cent above the former. You can think of the import-export ratio as a barometer of a trade imbalance’s equitableness. Exports create domestic employment and production, but imports compete with domestic jobs and output. So, the smaller the import-export ratio the more the benefits of exports are offsetting the cost of imports. Despite displaying similar-sized deficits, Mexico’s ratio is well below Germany’s. China’s deficit is not only the largest by far but it’s also among the most inequitable. Canada’s shortfall is the most equitable, when viewed through this narrow lens.
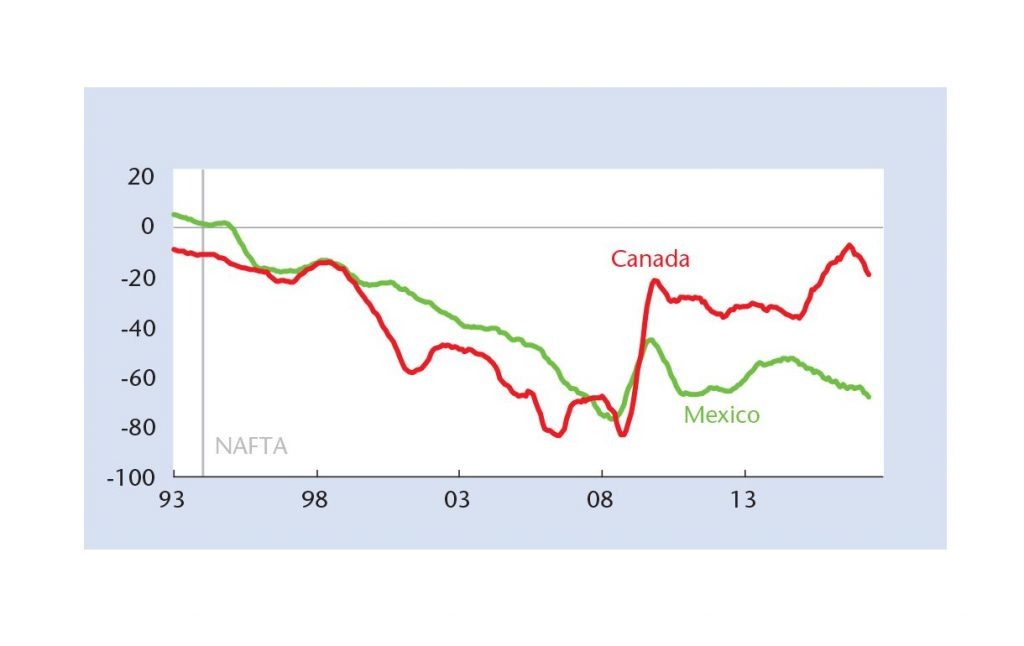
The press release accompanying the negotiation objectives said “since NAFTA was implemented in 1994, the U.S. bilateral goods trade balance with Mexico has gone from a $1.3 billion surplus to a $64 billion deficit in 2016.” While this is correct (Chart 2), it would be incorrect to conclude that the trade imbalance with Mexico is pervasive. Indeed, the U.S. ran a $74 billion deficit with Mexico in motor vehicle and parts alone in 2016, meaning it had a $10 billion trade surplus across all other goods combined. Nevertheless, President Trump has been fixated on the loss of automotive jobs and production to Mexico… recall his threat to impose a 35 per cent tariff on vehicles imported from Mexico and browbeating of U.S. auto industry executives to assemble more vehicles at home. It should be noted that U.S. vehicle assemblies are currently not far off pre-recession levels because of access to cheaper parts from Mexico that help offset higher U.S. labour costs.
The press release didn’t cite the trade imbalance with Canada, which, at $11 billion in 2016, was actually smaller than what it was when NAFTA was implemented in 1994 ($14 billion) (Chart 2 again). However, at times, the deficit with Canada has been larger than Mexico’s, reflecting episodes of high oil and other commodity prices (or an excessively weak loonie). The recent trend of smaller trade deficits with Canada (with a sprinkling of individual months in which the U.S. posted trade surpluses) not only reflects the collapse in oil prices. It also reflects Canada’s loss of export competitiveness to Mexico (partly currency related) and export capacity during the Great Recession that has been slow to be replaced. Instead, the press release said: “Market access issues have arisen in Canada with respect to dairy, wine, grain and other products—barriers that the current agreement is unequipped to address.”
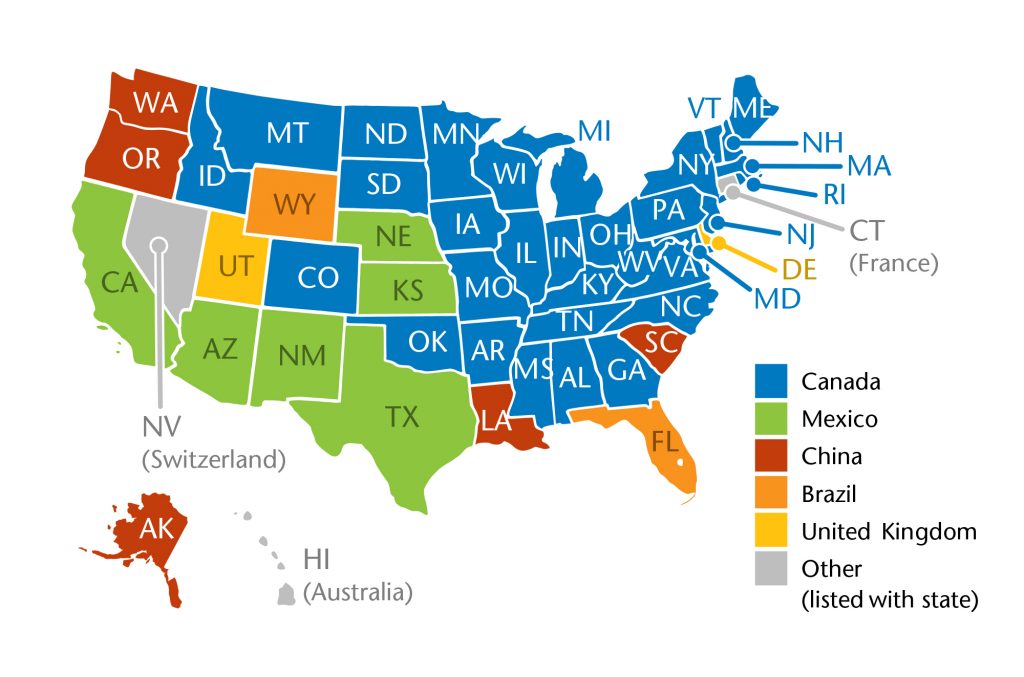 Similar to Mexico, America’s trade imbalance with Canada is also not pervasive. In 2016, the U.S. ran a $39 billion deficit in energy trade with Canada (crude oil, petroleum products, natural gas and electricity), meaning that it ran a $28 billion trade surplus across all other goods combined. Indeed, because the U.S. is not self-sufficient in energy and therefore must import to satisfy demand, Commerce Secretary Wilbur Ross recently referred to the trade imbalance with Canada as a “blameless deficit” (as opposed to a “blameful” one for which he didn’t cite a specific country). What is pervasive about Canada-U.S. trade is the number of states that count Canada as their largest export market, which was 32 in 2016 (Figure1). Canada is number 2 for another nine states. Mexico is the largest export market for six states and number 2 for 22 others.
 In addition to dealing with trade imbalances, the administration’s general objectives include “adding a digital economy chapter and incorporating and strengthening labor and environment obligations that are currently in NAFTA side agreements.” They also include eliminating “unfair subsidies, market-distorting practices by state owned enterprises, and burdensome restrictions on intellectual property.” Interestingly, Canada and Mexico have already agreed with the U.S. on some of the specific negotiation objectives in these areas as part of the Trans- Pacific Partnership agreement. The Trump administration pulled the U.S. out of TPP and it obviously wants some of its favourable (for America) aspects back. Having agreed before, it should be relatively easy to agree again on TPP-like components, but there are many other potential bumps in the road to getting NAFTA 2 done, particularly for Canada.
Michael Gregory, CFA, is Deputy Chief Economist of BMO Capital Markets.